10. Attach to a running process
For a program that is already running: a service, something started by another process, or a session you do not want to restart because reproducing the state took twenty minutes.
The attach configuration
You will not usually write this by hand. The
IDE plugin generates an attach configuration
for every project alongside its launch one — the same click, the same
launch.json — so if you already opened a project in VS Code that way, it is
already there, named Attach to <YourExe>.exe. What follows is what it
contains, for when you want to understand it, adjust it, or write one from scratch for a
case the plugin does not cover.
Set "request": "attach" and identify the process by id or by name:
{
  "name": "Attach to MyApp",
  "type": "delphi-win64",
  "request": "attach",
  "processName": "MyApp.exe",
  "program": "${workspaceFolder}/Win64/Debug/MyApp.exe",
  "sourceRoot": "${workspaceFolder}"
}
program is still worth giving: it is where the debugger reads symbols from.
The attach configuration shares sourceRoot,
sourceSearchPaths, modules, delphiProjectFile,
progressLocation and diagnosticLog with launch, and adds
processId, processName and killOnDetach. The full
table is in the
settings and commands reference.
delphiProjectFile is what keeps exception rules identical whichever way
you connect — there is no per-configuration rule storage any more, launch and attach
of the same project resolve the same project-scoped files.
Picking the process interactively
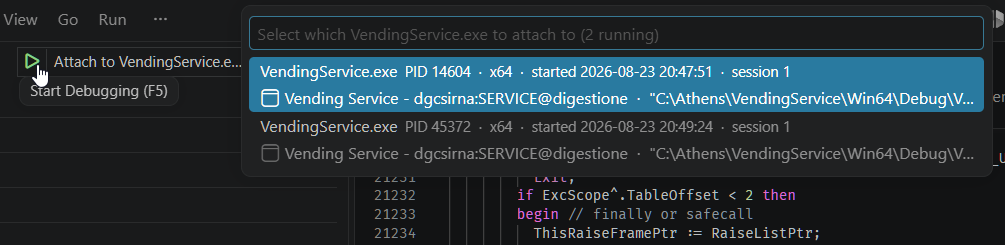
Use the pick-process command as the value of processId to choose at the
moment the session starts:
"processId": "${command:delphi-win64.pickProcess}"
You may not need to write that at all: a configuration that names a
processName but no usable processId brings up the picker by
itself, so an attach configuration you already have gains it without editing.
Each row carries what you need to tell instances apart:
- the executable name, its PID, architecture, start time and Windows session;
- the full command line, and the main window’s caption if it has one;
- a reason, for processes that cannot be debugged — those are listed and marked rather than hidden, so you are not left wondering where your process went.
Typing filters across all of it, not just the name, so a fragment of a command line narrows the list. Processes whose name matches your workspace folder are floated to the top and Windows’ own infrastructure is pushed down. And if a name filter matches exactly one process, the picker does not appear at all — it just attaches.
Escape in the picker cancels the whole session start.
There is no fallback to some default process, deliberately: attaching a debugger to
whichever process happened to be first in an enumeration is not a sane default.
The list comes from the debug adapter itself, not from Windows’ task list — which is
also available on its own: running the adapter with
--list-processes prints the same information as JSON and exits.
Privileges
Attaching requires SeDebugPrivilege. The adapter tries to enable it itself
through AdjustTokenPrivileges where the token allows, but in practice that
means either running the editor as Administrator, or attaching to a process you already
own.
Detaching
killOnDetach defaults to false for attach: ending the
session leaves the process running, which is almost always what you want when you
attached to something you did not start.
Breakpoints are
INT3 bytes patched into the target’s code, and only the
debugger that planted them can put the original bytes back. A clean detach does exactly
that. An adapter that is killed outright cannot — so the INT3 bytes stay
behind in a process that no longer has a debugger attached, and the next time execution
reaches one the program takes a breakpoint exception with nobody to handle it. What the
user sees is a mystifying External exception 80000003
(STATUS_BREAKPOINT) surfacing from the application’s own error handling,
long after the debugger is gone and with nothing to connect it back.
This applies to attached sessions only. A launched target dies together with the adapter, so there is nothing left to corrupt.
From an agent
The same operations are available over MCP — attach_to_process,
attach_from_config and detach_debugger — with the same rule
about detaching rather than terminating. See
Example prompts.