8. Expression evaluation
Watch, hover and the Debug Console share one Pascal expression evaluator. It is a real evaluator, not a variable lookup with arithmetic bolted on.
The grammar
| Category | Supported |
|---|---|
| Identifiers | Qualified identifiers, field and property access, array and open-array indexing |
| Arithmetic | + - * /, div, mod, shl, shr, unary -. Mixed integer and float operands promote to Double. |
| Logic | and, or, xor, not — logical for Boolean operands, bitwise for integer ones, as in Delphi |
| Comparison | The full set, on every type that supports it |
| Literals | True, False, nil, numbers, strings, and bare enum literals — Mode = wmPaused needs no qualifier |
| Strings | Concatenation with +. This allocates a real string in the debuggee. |
| Sets | Set algebra with +, - and * |
| Types | Type casts with the correct semantics per case, and is / as, driven by RTTI |
| Intrinsics | Length, SizeOf, Ord, Low, High, Assigned, Pred, Succ, Abs, Chr, Trunc, Round, Int, Frac, Copy, Pos, UpperCase, LowerCase |
| Addresses | Unary @ — useful for feeding an address to a data breakpoint or the memory view |
Operator precedence is Delphi’s, not C’s: and binds
like a multiplication and or / xor like an addition, both
tighter than any comparison. So Flags and MASK = 0 means what it means in
your source, and a > 1 and b < 2 needs its parentheses here exactly as
it does in the compiler.
Strings compare by their characters, ordinally, across all the string
types and against Char. A nil string reads as empty, and
comparing a string against something that is not text is refused with a reason rather
than quietly compared as a number.
Intrinsics the debugger cannot provide
The eighteen listed above are the ones that exist. The rest of Delphi’s built-ins are compiler magic with no symbol in the binary to call, so the debugger cannot run them — but it says so by name instead of reporting an unresolved symbol, which would read as though your variable were wrong:
<Format is a Delphi compiler intrinsic, not a function in the binary,
 so the debugger cannot call it: it takes an open array of const, which
 cannot be built from outside the process -- concatenate with + instead>
Twenty-five are answered this way, each with the reason and, where one exists, the thing
to write instead — Inc(X) tells you to write X + 1,
Include points at x in S, Addr at @X.
Several are refused on principle rather than for want of a symbol: New,
Dispose, SetLength and Halt would allocate, free,
mutate or end the debuggee, and evaluating a watch expression must not do any of that.
Calling methods and getters
Method calls and property getters in an expression execute in the debuggee. The stopped thread is hijacked to run them, and any state they change persists — a later evaluation sees the result of an earlier one. That is what makes it possible to ask a live object a question rather than reconstructing the answer from its fields.
It also means an expression can have side effects. Evaluating something that increments a counter increments the counter, for real.
If the call raises, or triggers an access violation, it is aborted cleanly: the thread context is restored and the evaluation returns a failure string. A broken expression does not take the session with it.
Hovering, and what exactly gets evaluated
Resting the mouse over code while stopped shows the value, as you would expect. What is
worth knowing is how much of the line it takes. The identifier under the cursor
is grown outwards into a whole Pascal expression — through . for a field
path, through […] for an index, through ^ for a dereference —
so hovering anywhere in Customer.Orders[3].Total evaluates the whole thing,
not the one word you happened to be over.
And if you select text first, the selection wins. Select any expression, hover inside the selection, and that is what is evaluated. This is the Delphi IDE behaviour, and it is here on purpose — but nothing in the interface advertises it, so it is worth knowing it exists.
Where the output goes
Three streams, deliberately kept apart, because mixing them is how you end up unable to tell what your program printed from what the debugger printed.
| Stream | Default destination |
|---|---|
| The debuggee’s own output | Debug Console |
| Debugger-generated output — notably logpoint text | Debug Console, as a separate channel from the above |
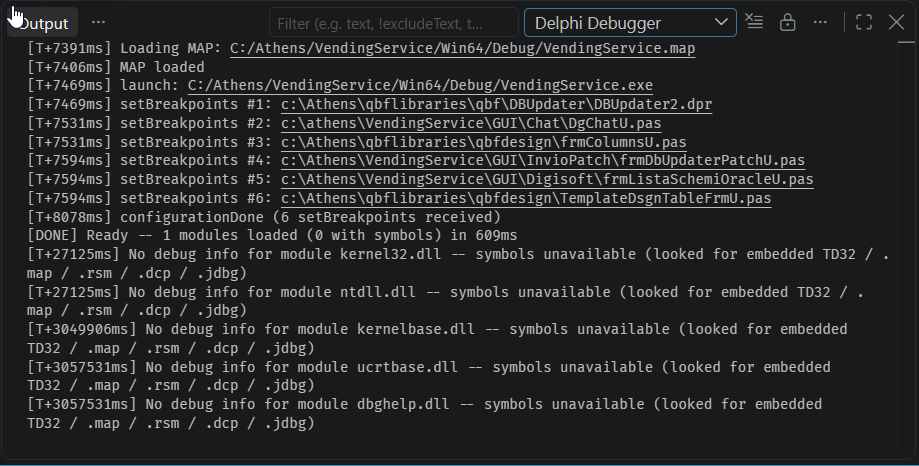
| The debugger’s own diagnostics | A separate “Delphi Debugger” channel in the Output panel, not the Debug Console. Change with diagnosticsLocation. |
When something is wrong with the adapter
Set "diagnosticLog": true in the launch configuration, or the
DAP_LOG=1 environment variable, and the adapter writes a verbose log to:
%TEMP%\dap_adapter.logIt is genuinely verbose and off by default for that reason, but it is the file to attach to a bug report, and the place where quietly-dropped things — a malformed exception rule, for instance — actually get reported.