5. Inspecting variables
Local variables come out of the Delphi .rsm format, which is where most of the
work in this project went. This chapter is what that buys you — and one hazard that is
worth knowing about before you meet it.
What is in scope
- Locals of the current procedure, and its parameters.
- Parent-procedure locals, seen from inside a nested procedure, at any depth of the lexical scope chain.
- Locals declared in the program’s main
begin..endblock. - Globals, and unit-scoped variables.
threadvar variables are not resolved, on either bitness. A
threadvar has no fixed address in the image, and the debugger reports that honestly rather
than showing you a plausible wrong value. See
Known limitations.
How values are shown
Formatting is type-aware: integers, floats, TDateTime, chars, ANSI and
Unicode strings, Variants, C-string pointers, and type aliases all render as what they
are rather than as raw storage. A dynamic array previews its contents inline —
[10, 20, 30], capped for long ones — and an empty or nil array
shows as [].
Expanding objects, records and arrays
- Class instances expand to all their fields, across every visibility level and every ancestor class, read through the VMT’s extended RTTI.
- Records expand through their
TypeInfo. - Dynamic arrays expand element by element, up to 1024 of them — past that the tree says how many were shown out of how many exist, rather than just stopping.
-
Generic collections —
TList<T>,TDictionary<K,V>, and nested generics — inspect and enumerate correctly rather than showing you their internal storage.
Expansion nests, so you can walk an object graph as far as it goes.
Properties, events and fields are separated
An object with published properties does not expand into one flat list. It splits into three groups — properties, event handlers and fields — because they answer different questions and only one of them is writable.
Only the fields group can be edited. A property is whatever its getter returns; writing to it would mean calling a setter, which is running your code, which the debugger will not do behind your back. If you want to change what a property reports, change the field behind it.
Indexed properties appear as leaves reading (indexed property) — there is no
index to supply from a tree view. Evaluate them by hand in Watch, where you can write the
index yourself.
![The Watch panel with a TList<TfraChatRow> expanded into properties, event handlers and fields groups. Items reads (indexed property); Disposed, Capacity, IsEmpty, List and PList read (expand to evaluate). The fields group is expanded down through FItems into element [0], a TfraChatRow object.](../../../assets/screenshots/delphi-debugger/tutorial-05-object-graph.png)
TList<fraChatRow.TfraChatRow> nested three levels deep —
the properties/event handlers/fields split, Items as an
(indexed property) leaf exactly as described above, and the fields group
walked down through the generic collection’s own FItems array into one
element. Not shown: a closure’s captured fields, which the original request for this
screenshot also asked for — still outstanding if you want to add one.Anonymous methods and closures
Expanding a captured closure shows its captured fields the way any other object expands. Stopping inside an anonymous method shows both the captured variables and the method’s own parameters.
Those parameters appear positionally, as arg1 to argN. That is
not a shortcut — the debug information for an anonymous method carries no names for them,
so there is nothing better to show.
Writing values back
Values can be edited in place in the Variables panel. What is supported:
- Primitives, floats, dates and chars, written at the correct storage width.
- Enums, by name or by ordinal.
- Sets, by bitmask.
- Strings, assigned in-process so the reference count stays correct and nothing leaks.
-
varparameters, which write through to the caller’s actual storage rather than to the local copy.
What matters in practice is how a value must be spelled when you type it in:
| Type | Write it as |
|---|---|
| Booleans | true / false, or a number. All three widths handled. |
TDateTime, TDate, TTime | 2026-08-17 14:30:00.000 — date alone and time alone both accepted — or the raw float |
| Floats | A number. Either . or , works as the decimal separator. |
| Chars | 'A' — quotes included, one character — or the ordinal |
| Integers | Decimal, negative included |
| Enums | The member name, or its ordinal — which is range-checked against the type |
| Sets | The bitmask, as a number |
| Strings | Bare or quoted; one layer of quotes is stripped |
setExpression request is not implemented. See
Known limitations.
Properties backed by getters
A property whose value comes from a getter cannot be shown without calling that getter — which means running your code, with whatever side effects it has, just because a panel was expanded. The debugger does not do that by default.
Instead there is a safelist, driven by three commands you reach by right-clicking the row — in the Variables view or the Watch view, either works: Always Evaluate This Property (Delphi), Never Auto-Evaluate This Property (Delphi), and Forget Evaluation Decision (Delphi) to undo either of them. A time budget also bounds how long a burst of automatic getter calls may hold up the panel, so a slow property cannot freeze the Variables view.
The decision is remembered across sessions — it is written to a file under your user profile, and the confirmation message names that file, so it can also be edited or reset by hand.
A property waiting for permission reads (expand to evaluate). Two variants
of that text mean something different, and the distinction saves you from chasing the
wrong thing:
| What the row says | What to do |
|---|---|
(expand to evaluate) |
No decision has been made for this property. Expand it, or allow it permanently. |
(expand to evaluate -- automatic evaluation budget spent at this stop) |
Nothing is wrong with this property — the time allowance for automatic getter calls was used up by the rows above it. Expand it directly, or allow the slow one above so it stops eating the budget. |
(expand to evaluate -- the getter call was cut short) |
The call started and ran too long. This getter does real work; consider whether you want it evaluated automatically at all. |
The budget is per group of rows, so the ordering matters: one slow getter near the top can push everything below it into the second state.
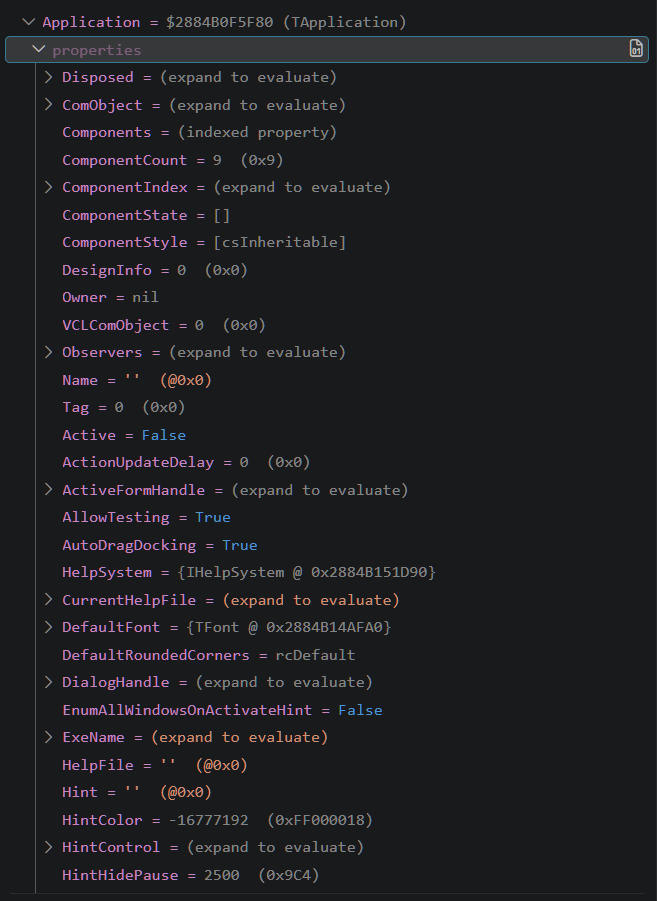
properties group open on TApplication — most
rows are getter-backed and deferred as (expand to evaluate), the rest evaluate
immediately because they read a plain field. Components is the
(indexed property) case from earlier. The event handlers and
fields rows sit above this scrolled view; see the
earlier figure for the three groups together on a different
object.Where the tree stops
Everything here is bounded, because a debugger that tries to render a million-element array freezes the panel it was meant to help you read. The bounds you can actually reach:
| What | Limit |
|---|---|
| Children shown when expanding | 1024, then a line saying how many exist |
| Dynamic-array preview on the collapsed row | First 50, then the total |
| String rendering | 4096 characters, then the total length |
| Nested-procedure scope climb | 32 levels of enclosing routines |
None of these truncate silently: the count of what exists is always shown next to what
was rendered, so a partial view never reads as a complete one. To look past a cap, watch
the element directly — Arr[50000] — rather than scrolling for it.
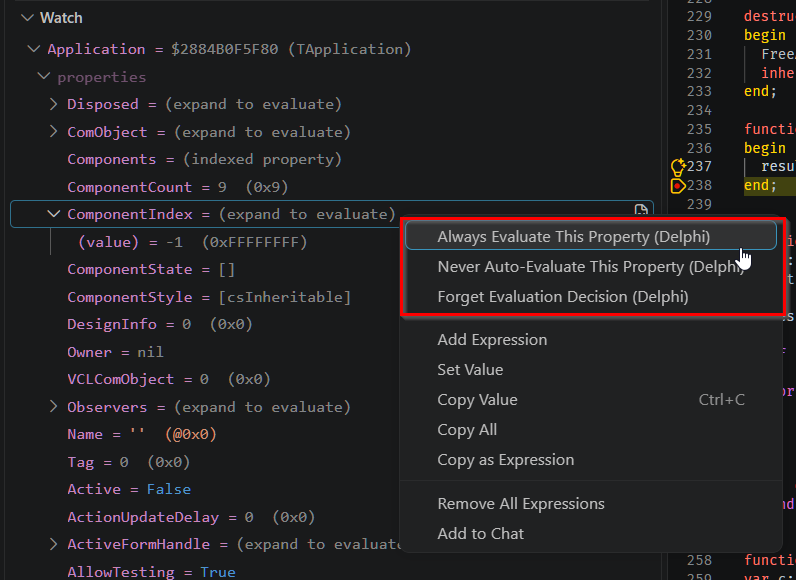
ComponentIndex, still waiting for a decision. They sit above the
ordinary Variables/Watch context menu entries, not in a submenu of their own.