1. Preparing your project
A debugger can only show what the compiler emitted. Almost every “it does not work” report against this debugger turns out to be a build without the debug information it needs, so this chapter comes first.
Compiler and linker settings
In the Delphi project options, for the Debug configuration of the platform you are building:
| Setting | Where | Value |
|---|---|---|
| Optimization | Compiling | Off (-$O-) |
| Debug information | Compiling | On |
| Local symbols | Compiling | On |
| Debug information | Linking | On |
| Include remote debug symbols | Linking | On — this is what emits the .rsm |
| Map file | Linking | Detailed |
| Use debug .dcus | Compiling | On — optional, lets you step into RTL and VCL source instead of over it |
On the command line that is:
dcc64 -$O- -V -VN -VR MyApp.dpr
Keep the .map and .rsm next to the .exe. The
adapter looks for them there by default.
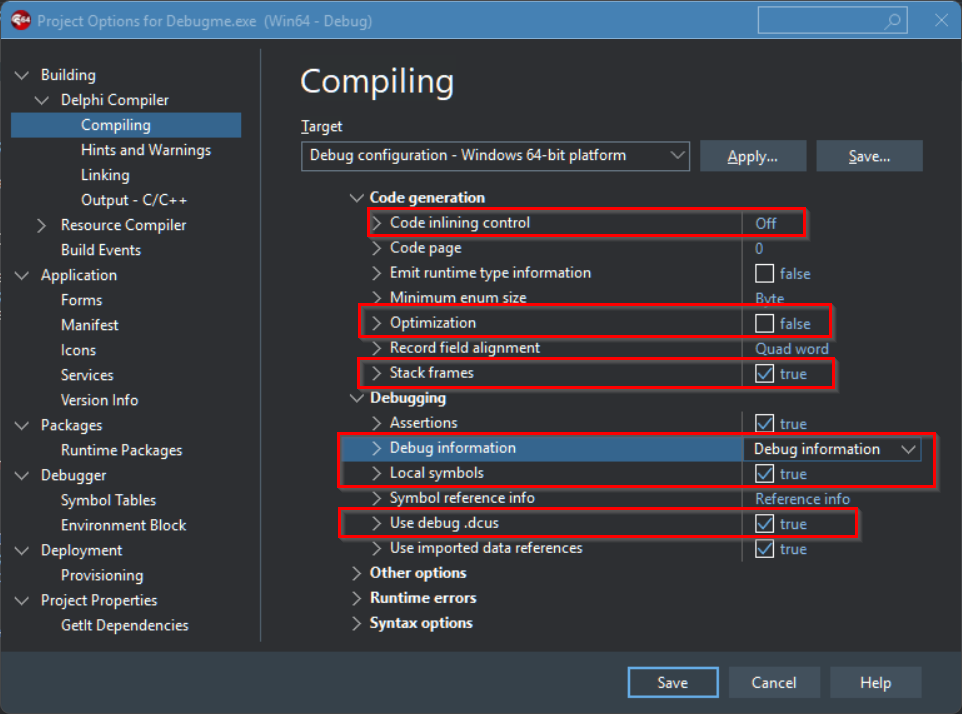
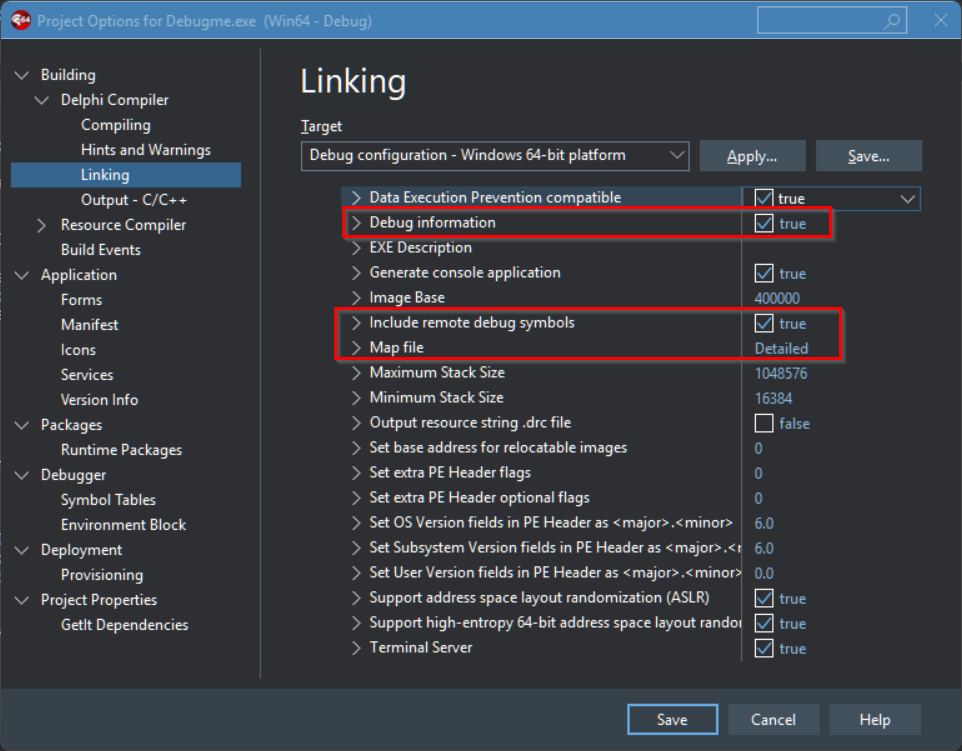
.rsm — and Map file
set to Detailed.What each artefact buys you
The settings above produce several separate pieces of debug information, and they do not all do the same job. What happens when one is missing:
| Missing artefact | Effect |
|---|---|
TD32 section, .map, or JCL data — any one of the three |
No source lines: no breakpoints, no stepping |
.rsm |
Breakpoints and stepping still work, but local variables, types and expression evaluation are severely limited |
| Optimizations left on | Breakpoints land on the wrong lines and locals read as garbage, because the code no longer matches the source |
The .rsm is genuinely optional — the debugger works without it, just with
reduced fidelity on locals and types. The source-line sources are not.
Symbol formats explains how the layers
fit together.
-$O-) build. With -$O+ the compiler routinely
omits the frame pointer and locals cannot be resolved at all. Run control — breakpoints,
stepping, call stacks — works on optimized 32-bit builds either way.
The launch configuration
.vscode/launch.json in the project being debugged. The
Edit in VS Code
IDE plugin writes this for you from the real Delphi project, which is what you want on
anything with a non-trivial search path. Here is the minimum by hand:
{
  "version": "0.2.0",
  "configurations": [
    {
      "name": "Debug Delphi Win64",
      "type": "delphi-win64",
      "request": "launch",
      "program": "${workspaceFolder}/Win64/Debug/MyApp.exe",
      "sourceRoot": "${workspaceFolder}",
      "stopAtEntry": true
    }
  ]
}
The properties you will actually reach for:
| Property | Default | What it does |
|---|---|---|
program | required | Path to the .exe to debug |
mapFile | same path as program, .map | Only needed when the MAP file is not beside the executable |
rsmFile | same path, .rsm | Same, for the file that carries local-variable information |
sourceRoot | empty | Root directory for source lookup |
sourceSearchPaths | empty | Extra source directories, each searched two levels deep |
args | empty | Command-line arguments passed to the debuggee |
stopAtEntry | false | Break at the process entry point before any user code runs |
modules | empty | Pre-binds debug-info files for runtime-loaded DLLs and BPLs — see chapter 9 |
delphiProjectFile | empty | The .dpr/.dpk/.dproj this configuration debugs — written by the IDE plugin, and what puts a project’s own exception rules in scope, see chapter 4 |
That is the working subset. The complete schema — including rawStackScan,
progressLocation, diagnosticLog,
diagnosticsLocation and the global exception-rules properties — is in the
settings and commands reference.
${env:BDS}/source is searched automatically, so RTL and VCL sources resolve
without listing them.
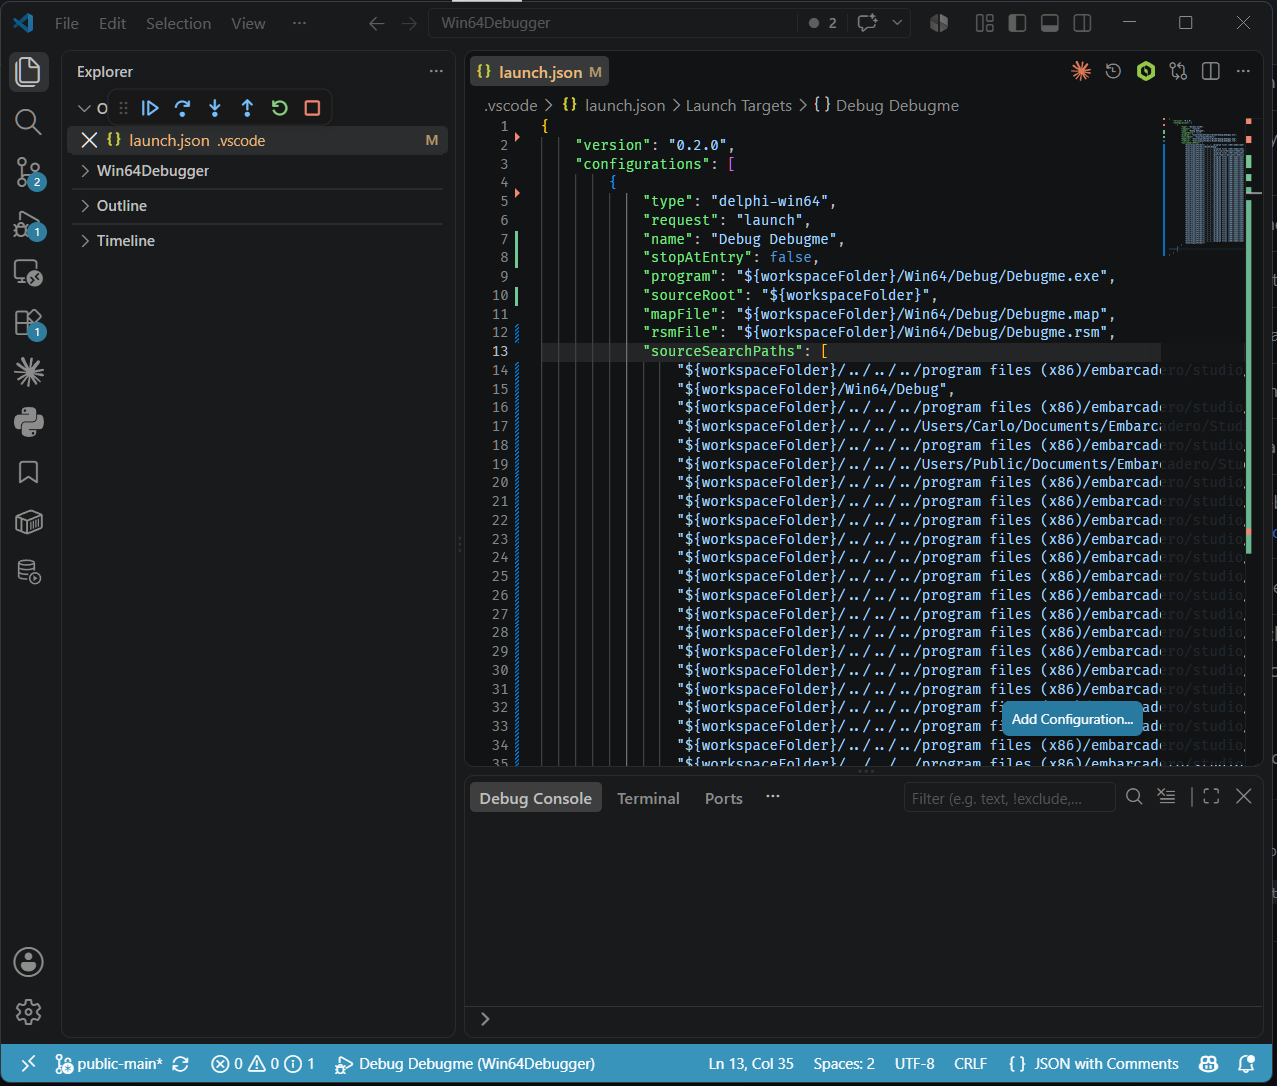
launch.json. program, mapFile
and rsmFile point at the build output; sourceSearchPaths is the
long, mechanical part — every include path the project used, spelled out so the
plugin generates it rather than anyone typing it by hand.Attaching instead of launching
Set "request": "attach" and give a processId or
processName instead of launching the program yourself. The attach
configuration shares program, sourceRoot,
sourceSearchPaths, modules and delphiProjectFile with
launch, and adds killOnDetach.
Chapter 10 covers it, including one
mistake worth knowing about before you try it.
Letting the IDE write it
A real Delphi project carries a couple of hundred unit search paths, an output directory
that depends on the configuration, and a list of runtime packages. Transcribing that by
hand is not a good use of an afternoon. The
Edit in VS Code
plugin adds an Open in Visual Studio Code command to the Delphi IDE that
generates the workspace file, launch.json and tasks.json from
the currently open project.
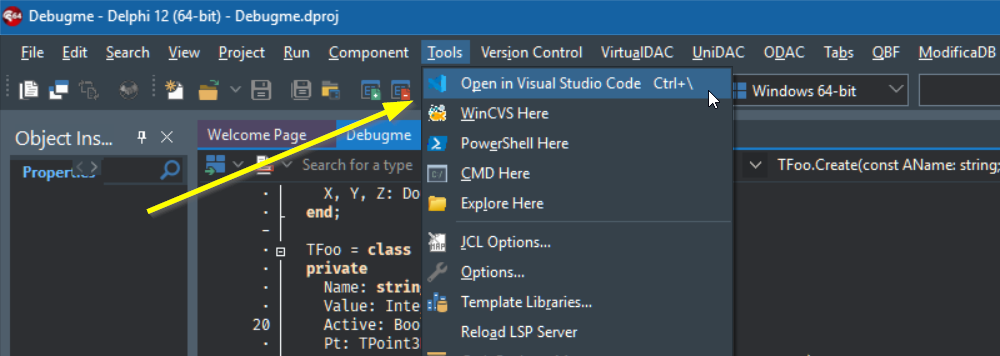
launch.json and
tasks.json are all generated from the currently open project.